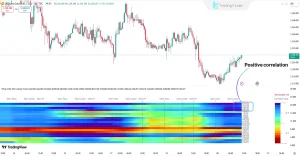
Recognizing bull market trends and patterns is an integral component of trading. One such pattern is the bull flag formation, which has proven highly successful when correctly identified.
Technical analysis uses charts and indicators derived from mathematical calculations based on price and volume data to reflect all available information in its prices. It assumes that all relevant details have already been factored into prices.
Trend Lines
Technical analysis utilizes several tools to predict future price action of assets, including trend lines, support and resistance levels and peak-and-trough analysis. These tools help traders identify entry signals in uptrends as well as exit points in downtrends; ultimately enabling informed trading decisions when bull markets arise.
Trend lines serve to indicate the general direction of price movement by connecting multiple low and high points on a chart with straight lines, creating a picture of where prices may move next. An uptrending trend line connects at least two higher lows; conversely, in downtrends it connects lower highs that serve as support or resistance levels.
Trend lines have one major drawback – they can be extremely subjective depending on your starting and ending points as well as chart time frame used, so traders will use them alongside other indicators and signals for confirmation.
Support & Resistance
Support and resistance levels enable traders to anticipate price reversals or breakouts. Technical analysts use price histories of assets or markets to establish these levels as support or resistance areas that have attracted buyers or sellers in the past.
Moving averages and Bollinger Bands can help identify key support and resistance zones; however, these tools may repaint past signals as new price data emerges to alter historical volatility.
Other indicators can help traders detect reversal and continuation patterns, including Fibonacci retracements and candlestick patterns. But it’s important to keep in mind that no tool provides a perfect trading solution and relying too heavily on these patterns can lead to mistakes; often breakouts above resistance or breakdowns below support are unsuccessful as price returns back within its previous trading range due to factors like volatility and trading volume that impact how price behaves at historically significant points.
Continuation & Reversal Patterns
One of the key skills required of traders is being able to recognize trends as they form. No matter your approach – be it risky or conservative – being able to recognize and classify trends will ultimately determine your success or failure in trading.
Technical analysis can help you spot reversal and continuation patterns that indicate when the current trend may continue or reverse. A double top or double bottom could signal that an upward momentum is increasing while V patterns could show when momentum has decreased.
Technical analysis also involves using technical indicators, which are mathematical formulas designed to make price data and trends easier to spot. They can help identify potential support and resistance levels for your trading strategy as well as volume spikes during key price movements that indicate strength or indicate possible reversals points.
Algorithmic Trading
A bull market refers to an environment in which asset prices increase due to investor optimism and economic indicators, typically as a result of economic expansion. Its primary feature is an upward trajectory in prices across various asset classes (from stocks and commodities to currencies). This dynamic gives traders unique opportunities for capitalizing on this dynamic by employing various trading strategies.
Technical analysis relies on price movements forming trends; these may be upward (bull run), downward (bear run) or sideways (rangebound). Traders look out for trends and look to capitalize on them.
There are various tools available to investors and traders for identifying trend lines and patterns, including line, bar and candlestick charts; momentum and volatility indicators provide insights into price movement using statistic algorithms; there are techniques which measure market sentiment by tracking investor or trader optimism or pessimism; these techniques may also benefit from using algorithmic trading, where computer programs execute orders quickly while making use of bid/ask spread profits to enhance profits from orders placed quickly by traders.


